


Below is the collective account of statistics across all the primary sectors of Bahrain Food Monitor. Here, you will find the general trends in all things concerning the Bahrain food market, including general food observations (by sector and year), comparative data analyses, and the possible reasons behind these trends.
Agriculture
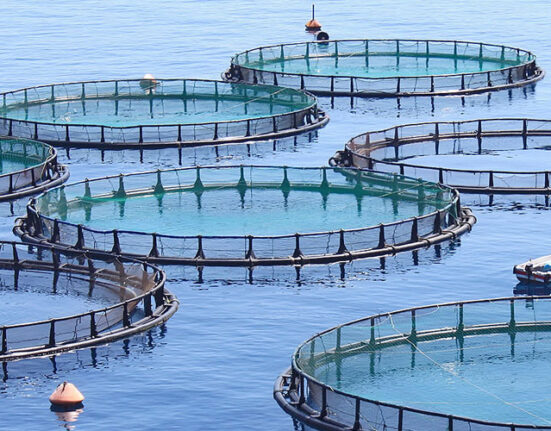
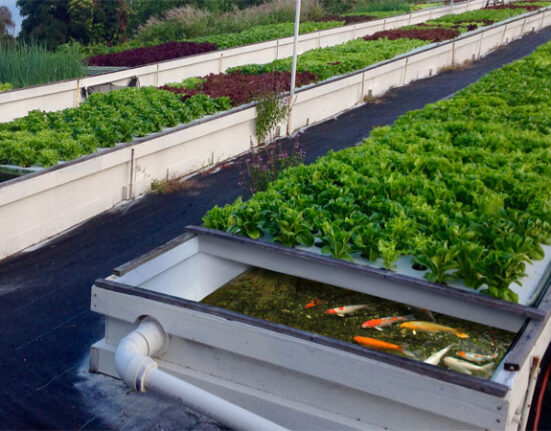
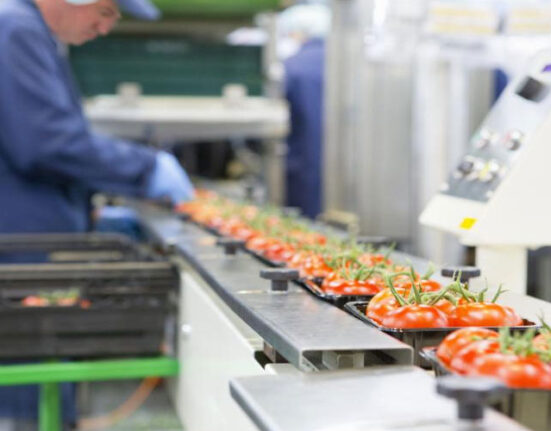
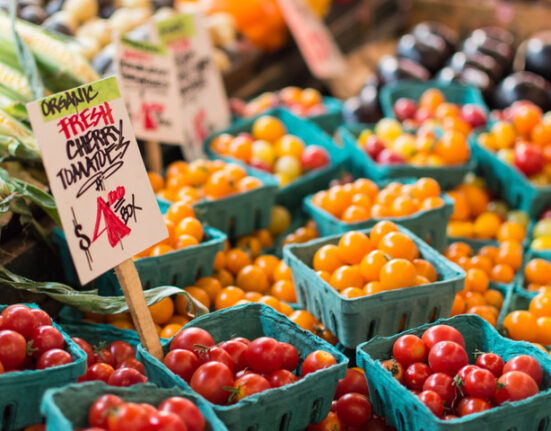
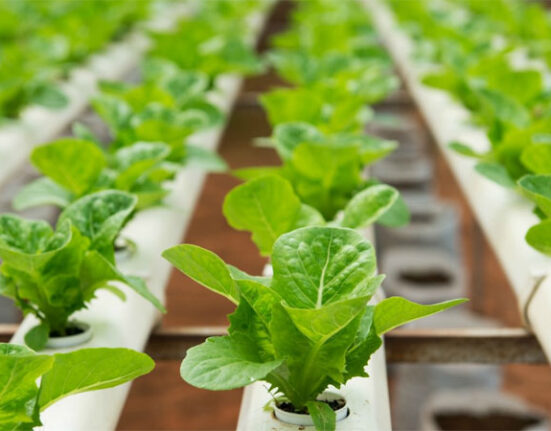
Bahrain’s agricultural environment may be understood by considering what types of exports it specialises in. As an arid piece of land, it is not surprising to see that it imports more soil-grown plants such as fruits and vegetables than it does export. However, this is not to say that this is also the case with fish for as will be seen, following dairy products, one of Bahrain’s other main exports are fish.
Graph to show the percentage of food exported from Bahrain in 2017
No Data Found
Graph to show the percentage of food imported to Bahrain in 2017
No Data Found
No Data Found
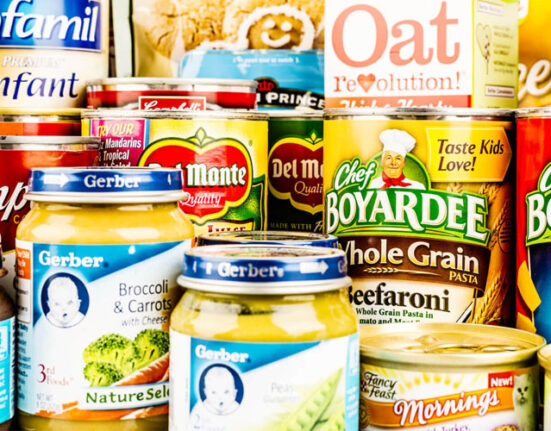
The chart above clearly shows that Bahrain’s biggest sector of imports falls under fruit and vegetables (at 34.4%) and other less specific food items comprising of canned foods as well as frozen and dry foods (at 37.3%), whilst fish is one of its least exported goods (at 1.2%).
Graph to show the percentage of food exported from Bahrain in 2017
No Data Found
Graph to show the percentage of food exported from Bahrain in 2017
No Data Found
No Data Found
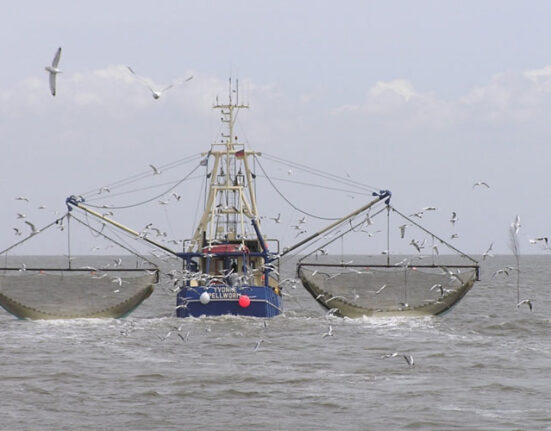
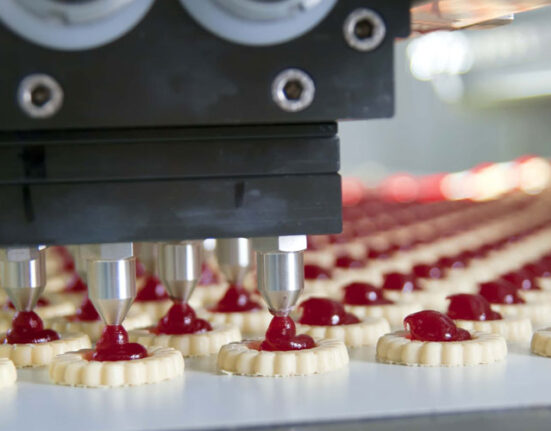
The chart above clearly illustrates that Bahrain’s largest sector of identifiable exports comprises of dairy products at 23.1%, and the lowest being poultry at only 0.1%. Since Bahrain imports most of its meat and fruits and vegetables, it becomes clear why the percentages of these sectors fall so low in the food produce they export. In fact, what can be shown here is that most of Bahrain’s meat exports fall under fish, peaking at 8.6% compared to the 1.2% of fish it imports.